CYBERTROOPS DASHBOARD

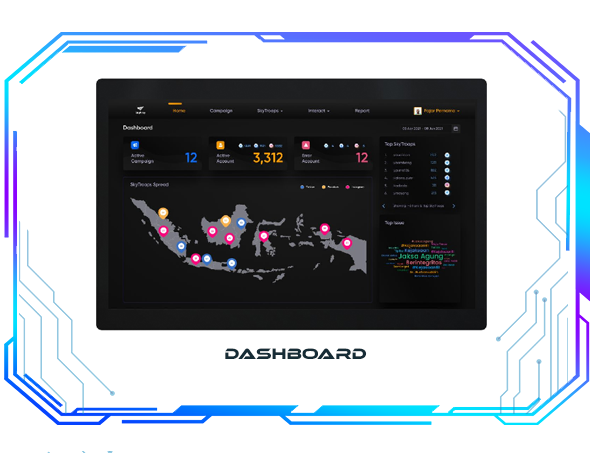
The Dashboard in the Application displays data such as active campaigns, active CyberTroops, inactive CyberTroops, top CyberTroops based on followers, and top issues based on active campaigns.
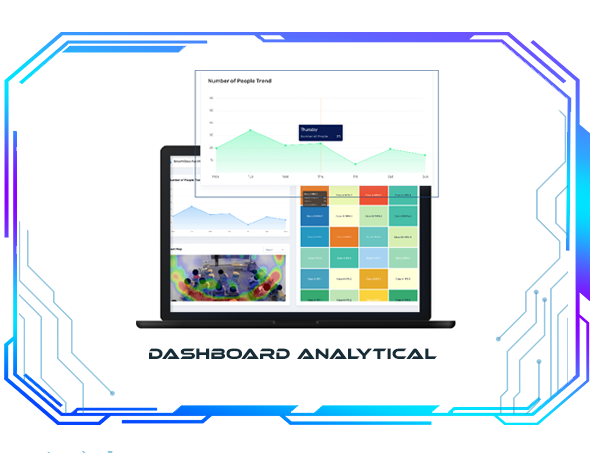
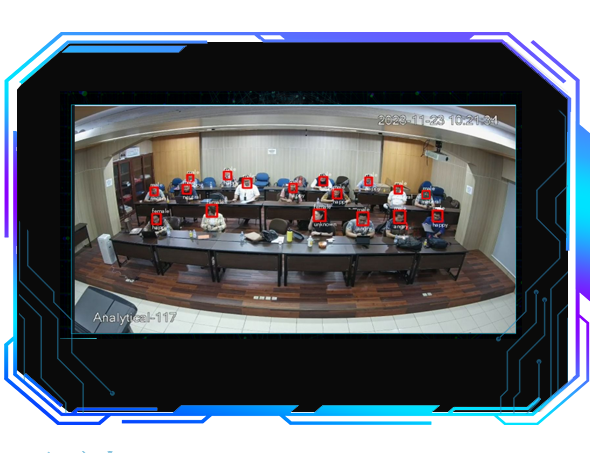
The Analytical Dashboard displays summary data of people detection results via CCTV cameras. These data include:
People Count Trend Statistics
These statistics show the history of the maximum number of people detected by the camera based on a specific time unit.
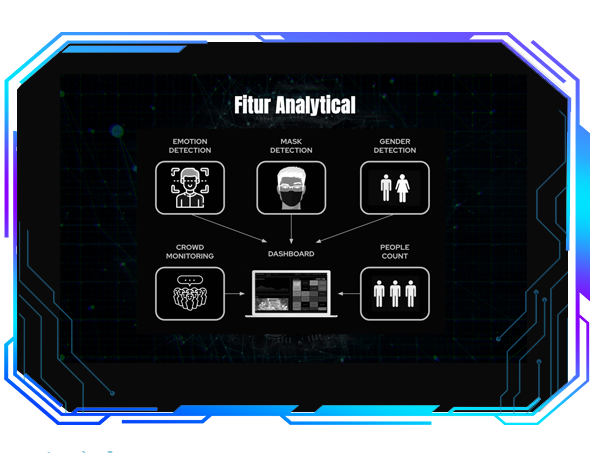
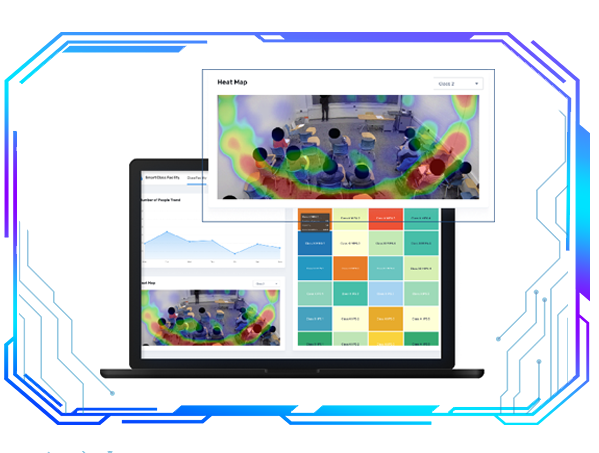
Heat Map
This feature is used to visualize or map data with different color representations. This feature shows the areas most frequently visited by people.

Emotion Analysis
- This feature is used to detect and classify the types of emotions of people visible within the camera frame.
Gender Detection
- This feature is used to detect and classify the gender of people visible within the camera frame. We can view gender comparison statistics based on a specific time unit.